1. Welcome to Aplia!
True or False: You will not be able to redo practice problems once the deadline passes.
False
For Graded at Deadline problems, the problems will be graded at the exact moment of the deadline ,and you will not be able to try a problem again after it is graded.
For Grade It Now problems, if you want to save your work and come back to it later, you should click Save and Continue , and you get 3 attempts at each problem.
Remember, after you’ve clicked the Grade It Now button, you can click on any of the blue bars labeled “Explanation” to open an explanation of the correct answer.
2. How Grade It Now problems are scored
Because you’ll be encountering a lot of Grade It Now problems, it’s important that you understand exactly how your score will be calculated.
As you have learned, you can try up to three versions of any Grade It Now problem until the problem set’s deadline. Your instructor may use one of three grading schemes. You will be able to view the chosen option by checking Grading Option on the Contents page that lists the questions for each problem set.
When the grading option is set to Average, the grade that is reported to you instructor is the average score of each of your attempts as of the deadline, including any work you have saved but not submitted for grading. If you earn 1, 5, 3, the grade would be 3, or the average of all attempts.
When the grading option is set to Do No Harm, the grade that is reported to your instructor will include an attempt in the average process only if it does not lower the current average. Your first attempt is your base grade. The second attempt counts if it is higher than the first. The third attempt counts (as an equal part) if it is higher than the average of the first and second attempts. For instance, if you earn 1,5, 2, the grade would be 3 because the average of 1 and 5, which is 3, is higher than 2. You will not be penalized for successive attempts at redoing the homework questions with this scoring method.
When the grading option is set to Keep the Highest, the grade that is reported to your instructor will be the highest score of all attempts.
If you click Save and Continue for a problem and then fail to return and finish it, your incomplete work will be graded at the deadline and will pull down your average score if your attempts are averaged. If you click Try Another Version, be sure to complete the new version of the problem, or you risk a zero on the attempt. If you save your work and don’t complete anything, you’ll receive a zero for that attempt.
Test your understanding with the following example:
Yolanda is working on Aplia assignments in Grade It Now mode. Each assignment consists of a single problem worth five points. Yolanda answers the problem and clicks Grade It Now. She gets 1/5 on the first attempt and 5/5 on the second attempt. She then clicks Try Another Version to try the question a third time, but she gets a phone call before she can work on it. She clicks Save and Continue and answers the phone. She gets distracted by the phone call and doesn’t return to the problem set before the due date. By saving the third attempt but falling to complete it before the due date, Yolanda’s forgotten attempt is saved and recorded.
3. Introduction to Aplia’s interactive tools
True or False: What you do in a graph doesn’t ever count toward your grade, so it doesn’t matter whether you adjust a graph or not.
False
True or False: You can still get full credit for a tool question as long as what you’ve done is pretty close to the right answer.
False
4. The graphs tool
The graphs tool is designed to let you create a diagram from scratch or add elements to an existing diagram. There are four different kinds of object you can place on the graph: points, lines, curves, and areas. Each object has both a color and a shape for easy reference. To place an object on the graph, drag it from the area to the right of the graph (the “palette”) onto the graph itself. There is only one right answer for each graphs problem; you will receive credit for placing an object correctly only if you put it in exactly the right spot. To make sure you have placed all the objects precisely where you wanted, you should hover your mouse pointer over each one before you submit your answer. The exact coordinates of any points you placed will appear, so you can sure you put the object in exactly the right spot – and make any necessary adjustments if you need to.
Try it out! On the following graph, place two red points (cross symbol) at the coordinates
(6, 14) and (14, 14), in the middle of each of the two blue circles. Then, plot an orange line (square symbols) passing through the three black points labeled X, Y, and Z. Finally, use the green triangle (triangle symbols) to fill the grey triangle in the middle of the graph.
(Hint: For more information on using the graphs tool, click the Help button at any time.)

5. The shifter tool
The shifter tool allows you to manipulate economic diagrams showing production possibilities frontiers (PDFs) or budget constraints (you’ll learn what these terms mean later in the course).
In the shifter tool, you’ll see a single blue line or curve. You may also see a point outlined in orange. If there is no orange point, your task will be to shift the line or curve by dragging its endpoints with your mouse. If there is an orange point, your task will be to move the point to the right location, which will be one of the “Snap-to-Points” shown by the + signs.
Suppose the following line represents combinations of dimes and nickels that add up to $20: For example, 200 dimes are worth $20, 400 nickels are worth $20, and 100 dimes plus 200 nickels are worth $20. Drag the orange dot to the point (200 nickels, 100 dimes).

Explanation:
You should have placed the point at the coordinates (200, 100), which lies midway along the line.
Again, suppose the following line represents combinations of dimes and nickels that add up to $20. Now shift the curve by dragging its endpoints (the blue points at the ends of the line) so that it shows combinations of dimes and nickels that add up to $10. That is, drag one endpoint to 200 nickels and the other to 100 dimes.

Explanation:
Since 100 dimes make $10, and 200 nickels make $10, you should have shifted the line so that it intersects the horizontal axis at a quantity of 200 nickels and the vertical axis at a quantity of 100 dimes.
6.The dragger tool
The dragger tool is designed to let you answer questions by shifting curves on a graph from one position to another, moving a point along a curve, or both. Economists love to shift curves, so you’ll probably use this tool a lot.
Let’s start by shifting a curve. Place your cursor over any part of the blue curve labeled “Demanded.” Now click the mouse button and hold it as you drag the curve to the right. You should see the curve move with your mouse. When you want to place the curve in its new position, just let go of the mouse button. The tool allows you to place the curve in only few positions, so the curve will snap into place once you have moved it. If the curve snaps back to its original position, just try again and drag it a little farther.

Explanation:
Notice that when you move the curve, the word “Demand” disappears. The diagram shows the old position of the demand curve in grey and labels it “D1,” while it shows the new position of the demand curve in blue and labels it “D2.” In other words, when you’ve completed a diagram like this one, it should show the original positions of the curves as well as the new positions, to let you compare the situations before and after the shift.
Now let’s try moving the point along the curve. Place your cursor on top of the black point located in the middle of the curve. Now, drag the point along the curve. Notice that you can drag it only along the curve. If you try to drag the point off the curve, you won’t have much luck.
Place the point on the curve below and to the right of its original position. The tool allows you to place the point in only a few positions, so the point will snap into place once you have moved it. If the point snaps back to its original position, just try again and drag it a little farther.

When you are satisfied with you answers, click the Grade It Now button.
Explanation:
If you got either of these questions wrong, you might want to click Try Another Version at the bottom of the page to try again.
7. The calculator tool
The calculator tool is used to generate data from a diagram. The diagram may show an orange line and/or a blue line (usually these represent supply and demand curves, but not always) and also has a green vertical or horizontal line. You can move this green line around.

These are boxes with numbers to the right of the diagram. As you move green line around, some of the these numbers change. In this case, the green line represents the price of breakfast cereal, and the numbers to the right of the diagram show the quantity of breakfast cereal demanded and supplied at any price you set.
Notice that you also set the price by typing it directly into the Price box (the top box on the right-hand side). On the graph above, change the price of cereal to $7 per box. You can see that at this price will be 125 million boxes of cereal demanded and 417 million boxes of cereal supplied. Reading from the calculator, you can also see that this causes a “surplus” of 292 million boxes per year.
The calculator tool is usually employed to help you find a numeric answer to a question. Consider the Supply Shifter section of the calculator tool. The entry field next to Price of Gasoline indicated that the initial price of gasoline is $3 per gallon. To see what happens in the market for cereal if the price of gasoline increases, type “4” in the Price of Gasoline box and click the Calculate button. Make sure the green line representing the price of cereal is at $7 per box (if it’s not, move it now). Now the Quantity Supplied box display 333 million boxes.
Explanation:
If you type “4” in the Price of Gasoline box and click Calculate button, and then move the green line to $7 per box (so “7” appears in the Price box), the Quantity Supplied box should display 333 million boxes. If you got this wrong, click Try Another Version to try again.
8. Different question styles
Which of the following actions would allow you to scroll down the page? Check all that apply.
X Click the Down arrow at the bottom of the scroll bar on the right side of the
screen.
Press the Backspace key on the keyboard.
X Use your mouse to drag the scroll bar on the right side of the screen.
In many questions, you will be asked to fill in blanks in order to complete sentences or enter values into a table. When you see a blank menu, click it and your list of options will be revealed. Select your answer and proceed. You can select only one answer from a dropdown menu.
Radio button questions and blanks must have only one correct answer. Meanwhile, checkbox questions may contain multiple correct statements.
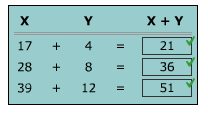
In some cases, you may need to answer questions by completing tables or selecting radio buttons and/or checkboxes in a table. Complete the table by dividing 21 by 6 and using the dropdown menu to select your answer.

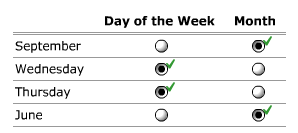
Now use the table to classify each item in the left column as either a day of the week or a month.
9. Numeric and text entry
10. Matters of time
What happens if you are signed in to Aplia but you don’t click any of these buttons for an hour or more?
You are automatically signed out of Aplia, and any answers you have not submitted or saved are lost.
How do you submit your answers to your instructor?
Just click the Grade It Now or Save and Continue button after you’ve answered each question.
Suppose your Assignments page lists the deadline for a particular assignment as 11:00 PM (which means 11:00:00). If you submit an answer at 11:00:37 PM (that is, 37 seconds after 11:00 PM), which of the following will happen?
The server will reject your answer because the deadline has passed.
Consider the following statement: “Modern computer hardware, software, and networks are so reliable that you can count on being able to submit your answers to online assignments in the last 10 or 20 minutes before a deadline.”
Pick the best response.
If you put off assignments until the last minute, you run the risk you not being able to submit them on time.
11. If you need help
If you are having technical problems with the Aplia website, what is the first thing you should do?
Run the System Configuration Test, located on the Aplia homepage
In which of the following situations should you contact Aplia Support (by clicking the Support link in the upper-right corner of any Aplia page)? Check all the apply.
X You can’t register.
X You need help using the site.
X You are unable to submit your answers.
X You’re experiencing a technical problem, and running the System Configuration Test hasn’t fixed it.


